Tournament Set (Q7-11) + Venn Diagram Set (Q12-15) | CAT 2024 Slot I
🎯 Question 7 showcases AI-Enhanced features | Compare with standard questions (Q8-15) to see the difference!
📊 Pre-Question Analysis
✨ AI Enhanced
Difficulty Level
70th Percentile
50th75th90th99th
Expected Time
2-3 minutes
90th %ile: 1.5-2 min
50th %ile: 3-4 min
Question Type
Tournament Scheduling
Constraint satisfaction problem
Set Dependency
⚓ ANCHOR
Unlocks Q8, Q9, Q10, Q11
⏱️ First 60 Seconds Protocol▶
Read constraint 4 & 3 first: Identify "only once" vs "exactly twice" - this reveals groups
Count teams & structure: 6 teams, 2 groups of 3 each
Spot the pattern: "Identical rounds" mentioned twice - this is a pairing constraint problem
Quick calc check: Can you do C(3,2)×2 + 3×3×2 in your head? If yes, proceed
Decision point: If you can't identify groups in 60 seconds, skip this set
🔍 Pattern Recognition Guide▶
This problem combines 3 classic patterns:
Group Partitioning: "only once" → same group, "twice" → different groups
Constraint Satisfaction: Build structure using given constraints + elimination
Anchor Question: Solving this unlocks 4 follow-ups (high ROI)
Where you've seen this before:
IPL scheduling problems
Chess tournament pairings
Any "round-robin with groups" scenario
✅ Should I Attempt This?▶
✅ ATTEMPT IF:
You can identify groups within 60 seconds
You're comfortable with combination formulas (nCr)
You have 6+ minutes available for the full set (Q7-11)
You're targeting 85th+ percentile (this is a differentiator)
⏭️ SKIP IF:
After 90 seconds, you can't figure out the groups
You have less than 5 minutes left in DILR section
You're uncomfortable with constraint satisfaction problems
You've already attempted 2 sets successfully (focus on QA)
💡 Strategic Note: This is an ANCHOR question. Investing 2-3 min here saves 6-8 min across Q8-11. Expected return: 12-15 marks for ~6 min total investment.
DIRECTIONS for questions 7 to 11: Read the information given below and answer the question that follows
The game of QUIET is played between two teams. Six teams, numbered 1, 2, 3, 4, 5, and 6, play in a QUIET tournament. These teams are divided equally into two groups. In the tournament, each team plays every other team in the same group only once, and each team in the other group exactly twice. The tournament has several rounds, each of which consists of a few games. Every team plays exactly one game in each round. The following additional facts are known about the schedule of games in the tournament.
1. Each team played against a team from the other group in Round 8.
2. In Round 4 and Round 7, the match-ups, that is the pair of teams playing against each other, were identical. In Round 5 and Round 8, the match-ups were identical.
3. Team 4 played Team 6 in both Round 1 and Round 2.
4. Team 1 played Team 5 ONLY once and that was in Round 2.
5. Team 3 played Team 4 in Round 3. Team 1 played Team 6 in Round 6.
6. In Round 8, Team 3 played Team 6, while Team 2 played Team 5.
7. How many rounds were there in the tournament?
💡 Progressive Hints - Try solving first!
Click hints progressively only if stuck. Try to solve with minimal hints for maximum learning!
🔍 Hint 1: Understanding the Structure
Key insight: This is a counting problem + structure-building problem.
Total games = In-group games + Cross-group games
In-group: Each group has 3 teams. Teams play each other once = C(3,2) = 3 games per group × 2 groups = 6 games
Cross-group: 3 teams × 3 teams = 9 pairings, each meets twice = 18 games
Total: 6 + 18 = 24 games
Rounds: Each round has 3 games (all 6 teams play once) → 24 ÷ 3 = 8 rounds
💡 Try answering now! If still stuck, click Hint 2.
🧩 Hint 2: How to Approach
Two methods to solve:
Method 1: Quick Formula (30 seconds)
Calculate total games using formula above
Divide by games per round (3)
Answer: 8 rounds ✓
Method 2: Build Complete Table (2-3 minutes)
Identify groups first (use "only once" clues)
Fill given constraints into rounds
Use elimination to complete the table
Count rounds ✓
🎯 Strategic Choice: Use Method 1 if you ONLY want to answer Q7. Use Method 2 if you plan to attempt Q8-11 (recommended - builds table once, answer 5 questions!).
💡 Ready to solve? If you want to see the complete solution, click Hint 3.
✅ Hint 3: Complete Solution
This reveals the full solution below. Scroll down to see the detailed step-by-step approach with the complete tournament table.
⚠️ Learning Tip: After viewing the solution, try solving a similar problem on your own without looking at hints. This solidifies your understanding!
1. Quick Formula Approach▶
💭 Strategic Thinking:
"Do I just need the answer to Q7, or am I solving the whole set? If just Q7, formula is faster. If Q8-11 too, I should build the complete table. Let me check: I have 6+ minutes available, so I'll build the table."
In-group games: C(3,2) × 2 groups = 3 × 2 = 6 games Cross-group games: 3 × 3 × 2 meetings = 18 games Total games: 6 + 18 = 24 games Games per round: 3 (each team plays once per round) Total rounds: 24 ÷ 3 = 8 rounds
💡 Mental Math Shortcut:
Don't write "C(3,2)". Visualize: "3 teams, pick 2 → that's 3 pairs (1-2, 1-3, 2-3)". Then: "3 pairs × 2 groups = 6. Plus 3×3×2 = 18. Total 24. Divide by 3 = 8." Do this in your head!
⏱️30-Second Checkpoint
If you chose formula method: You should have the answer "8" by now. Mark it and move to Q8.
If building table: You should have identified groups by now (Group A: 1,5,6 | Group B: 2,3,4). If not, re-read constraints 3 & 4.
Verification:
Each team plays 8 games: 2 in-group + 6 cross-group = 8 rounds ✓
2. Visual Structure Builder - Build the Complete Schedule
Step 1: Identify Groups
💭 Critical First Step:
"I need to figure out which teams are in which group. Let me scan for 'only once' vs 'twice' clues. Constraint 4 says Team 1 played Team 5 ONLY once - that's a same-group indicator! Constraint 3 says Team 4 played Team 6 in Round 1 AND Round 2 - that's twice, so different groups!"
Logic: Team 1 played Team 5 only once → same group. Team 4 played Team 6 twice → different groups.
From Round 8 (all cross-group): 3-6 and 2-5 are pairs, so 1-4 must be the third pair → Team 1 and Team 4 are in different groups.
Group A: 1, 5, 6
Group B: 2, 3, 4
⏱️1-Minute Checkpoint
You should have identified both groups by now. If not, you're spending too much time - consider skipping this set.
Quick verification: Each group should have exactly 3 teams. Group A (1,5,6) ✓ | Group B (2,3,4) ✓
Step 2: Fill Given Constraints
Round
Match 1
Match 2
Match 3
Source
R1
4 vs 6
?
?
Given (constraint 3)
R2
4 vs 6
1 vs 5
?
Given (constraints 3, 4)
R3
3 vs 4
?
?
Given (constraint 5)
R4
?
?
?
R4 = R7 (constraint 2)
R5
3 vs 6
2 vs 5
1 vs 4
R5 = R8 (constraint 2)
R6
1 vs 6
?
?
Given (constraint 5)
R7
?
?
?
R7 = R4 (constraint 2)
R8
3 vs 6
2 vs 5
1 vs 4
Given (constraint 6, all cross-group)
Step 3: Use Elimination Logic
1
Fill R2 Match 3
In R2, Teams 4, 6, 1, 5 already played. Remaining: 2 and 3 → 2 vs 3
2
Determine R4 and R7
Team 4 needs 2 matches vs Team 5 (cross-group). R4 = R7, so → 4 vs 5 in both R4 and R7
3
Fill R6 using Team 4's schedule
Team 4 has played in R1,R2,R3,R4,R5,R7,R8. Missing R6 → must play Team 2 (the only opponent left) → 4 vs 2
Remaining teams in R6: 3 and 5 → 3 vs 5
4
Complete R4 and R7
Team 2 needs 2 matches vs Team 6 (cross-group). R4 = R7 → 2 vs 6 in both
Remaining: 1 and 3 → 1 vs 3 in both R4 and R7
5
Complete R1 and R3
Team 1 needs 2 matches vs Team 2 → 1 vs 2 in R1 and R3
R1 remaining: 3 and 5 → 3 vs 5
R3 remaining: 5 and 6 → 5 vs 6
Complete Master Schedule
💭 Solution Mindset:
"Perfect! I've filled all rounds systematically using constraints and elimination. Now I have the complete 8-round schedule. This single table will let me answer Q7, Q8, Q9, Q10, and Q11 instantly. Time well invested!"
⏱️2.5-Minute Checkpoint
You should have a complete 8×3 table by now.
Quick verification:
Every team appears exactly once per round ✓
Team 4 vs Team 6 appears in R1 and R2 ✓
R4 matches = R7 matches ✓
R5 matches = R8 matches ✓
If all checks pass, proceed with confidence!
This table answers Q7 and is used for Q8-11
Round
Match 1
Match 2
Match 3
1
4 vs 6
1 vs 2
3 vs 5
2
4 vs 6
1 vs 5
2 vs 3
3
3 vs 4
1 vs 2
5 vs 6
4
4 vs 5
2 vs 6
1 vs 3
5
3 vs 6
2 vs 5
1 vs 4
6
1 vs 6
4 vs 2
3 vs 5
7
4 vs 5
2 vs 6
1 vs 3
8
3 vs 6
2 vs 5
1 vs 4
Correct Answer:
8
SET STRATEGY - Q7 is the ANCHOR
This question unlocks the entire set. Invest 2-3 minutes building the complete schedule table here.
Once done, Q8-11 become simple table lookups (15-30 seconds each).
If you cannot solve this in 3 minutes, skip the entire set.
❌ Common Mistakes & Wrong Answers▶
Wrong Answer: 9 rounds
~23% choose this
Why this answer is tempting:
Students often add an extra round thinking "each group needs an internal round-robin (3 rounds each) plus 3 inter-group rounds = 9 total". This misses that rounds can mix in-group and cross-group games.
How to avoid this trap:
Always calculate: Total games ÷ Games per round. Don't try to reason about round types separately. The structure allows mixed games within rounds.
Wrong Answer: 12 rounds
~15% choose this
Why this answer is tempting:
Result of double-counting: "3 × 3 cross-group pairings, each meeting twice = 9. Plus 3 in-group per group × 2 = 6. Total 15... hmm, round it to 12?" This comes from confusion about the calculation.
Cognitive reason:
When overwhelmed, students sometimes skip proper calculation and pick numbers that "feel right" based on problem complexity. More constraints ≠ more rounds!
Mistake 1: Double-counting cross-group games
Wrong: 3×3 pairs × 2 meetings × 2 groups = 36 games Right: 3×3 pairs × 2 meetings = 18 games Why: Each pair is already counted once; we just multiply by 2 meetings
🧠 Cognitive reason: Our brain thinks "Group A's perspective + Group B's perspective" but a game between groups is one mutual event, not two separate events.
Mistake 2: Solving without building the table
Wrong: Trying to answer Q8-11 using logic alone Right: Build complete schedule table in Q7, then lookup for Q8-11 Why: Table-building saves 80% time on follow-up questions
🧠 Cognitive reason: Students often think "I can figure each out independently" but miss that these are DEPENDENT questions. Recognize anchor patterns!
Mistake 3: Equal time distribution
Wrong: Spending 1 minute on each of Q7-11 Right: Q7: 2-3 min, Q8-11: 15-30 sec each Why: Anchor question unlocks the rest
🧠 Cognitive reason: Fairness bias - we think "equal time = fair" but in CAT, strategic inequality is optimal. Front-load effort on anchors!
Mistake 4: Not verifying the completed table
Wrong: Filling table and immediately marking answer without checking Right: Spend 15 seconds verifying: R4=R7? R5=R8? All constraints met? Why: One error in table corrupts answers to Q8-11
🧠 Cognitive reason: Completion bias - once we finish something, brain wants to move on. Force yourself to verify anchor solutions!
🎓 Learning Outcomes & Transferable Skills▶
Skills You Practiced:
Group PartitioningConstraint SatisfactionSystematic EliminationStrategic Time AllocationCombinatorics (nCr)Table Construction
Detailed Skill Breakdown:
Group Identification: Using "only once" vs "exactly twice" clues to determine group membership
→ Transfers to: Set theory problems, classification tasks, any partition-based logic
Constraint Satisfaction: Filling table systematically using given constraints and elimination logic
→ Transfers to: Sudoku, seating arrangements, scheduling, resource allocation
Set Strategy: Recognizing anchor questions and allocating time accordingly
→ Transfers to: ANY multi-question set, project prioritization, exam strategy
Visual Structure Building: Creating master tables that unlock multiple questions
→ Transfers to: Data organization, matrix problems, relationship mapping
Software Engineering: Dependency resolution, test case generation
Key Takeaways:
1. Anchor Recognition: In DILR tournament sets: Build the master schedule table once, then all follow-up questions become simple lookups. Don't solve each question independently.
2. Pattern Recognition: When you see "groups", "rounds", "plays each other X times" → immediately think: This is a scheduling/tournament problem. Count total games, identify groups, build structure.
3. Strategic Inequality: Not all questions deserve equal time. Front-load effort on anchors, reap benefits on follow-ups. This is THE difference between 70th and 99th percentile.
🧪 Self-Test: Check Your Understanding▶
💡 Learning Tip: Try answering without looking back at the solution. This tests true understanding, not just memory!
Q1: Without looking, can you recall which constraint helped you identify the groups?
Answer: Constraint 4 ("Team 1 played Team 5 ONLY once") - the word "ONLY" indicates same group. Constraint 3 shows Team 4 played Team 6 twice (R1 and R2), indicating different groups.
Q2: If there were 8 teams in 2 groups of 4 each, with same rules (in-group once, cross-group twice), how many rounds would there be?
Answer: 14 rounds Calculation:
• In-group: C(4,2) × 2 groups = 6 × 2 = 12 games
• Cross-group: 4 × 4 × 2 = 32 games
• Total: 12 + 32 = 44 games
• Games per round: 4 (8 teams, each plays once)
• Rounds: 44 ÷ 4 = 14
Q3: What's the most common mistake students make in this problem, and why does it happen?
Answer: Double-counting cross-group games (3×3×2×2 = 36 instead of 18). Why: Cognitive bias - brain thinks from both groups' perspectives ("A plays B" and "B plays A") but forgets a game is ONE mutual event. Also, time pressure makes students skip logical verification.
Q4: You have 5 minutes left in DILR, haven't attempted any set yet, and see this Q7-11 set. What should you do?
Answer: SKIP THIS SET. Reasoning: This set requires 6+ minutes for optimal ROI (2-3 min on Q7, then Q8-11). With only 5 minutes, you'll either:
• Rush Q7 and make errors (corrupting Q8-11), or
• Solve Q7 correctly but run out of time for Q8-11 Better strategy: Look for a simpler 2-3 question set that you can complete in 5 minutes, or switch to QA section.
🔀 Alternative Approaches▶
We showed you the "standard" method above. Here are other valid approaches:
Alternative 1: Team-by-Team Analysis
Approach: Instead of building full table, track one team (say Team 1) and count its games:
Team 1 is in Group A with Teams 5 and 6
In-group games: vs Team 5 (1 time) + vs Team 6 (1 time) = 2 games
Cross-group games: vs Team 2, 3, 4 (each twice) = 6 games
Total games for Team 1 = 8 games = 8 rounds (since 1 game per round)
Pros: Faster (1-2 min), sufficient if you only need Q7
Cons: Doesn't help with Q8-11, so lower overall efficiency
When to use: If you're short on time and only answering Q7, or as a verification method
Alternative 2: Reverse Engineer from R8
Approach: Start from Round 8 (all cross-group) and work backwards:
R8 tells us groups: {1,5,6} vs {2,3,4}
R5 = R8 (constraint), so R5 is also cross-group
That's 2 rounds of cross-group so far
Cross-group needs 18 games total ÷ 3 per round = 6 rounds
In-group needs 6 games ÷ 3 per round = 2 rounds
Total: 6 + 2 = 8 rounds
Pros: Uses constraints strategically, feels more "logical"
Cons: Requires clear thinking under pressure, easy to make arithmetic errors
When to use: If you're strong with mental math and constraint-based reasoning
Alternative 3: Formula-First, Then Verify
Approach: Use formula to get answer quickly, then spot-check with constraints:
Pros: Fastest method (45 seconds total), high confidence
Cons: Verification isn't rigorous (but good enough for MCQ)
When to use: When you're confident in formula and just need Q7 answer
🎯 Meta-Learning:
Notice how different approaches optimize for different goals:
Formula-first: Optimizes for speed on Q7 only
Table-building: Optimizes for total set efficiency (Q7-11)
Team-tracking: Middle ground - faster than table, more thorough than formula
Skill to develop: Choose method based on your strategy (how many questions you'll attempt) and time available. This is called adaptive problem-solving.
📈 Practice This Concept - Graduated Difficulty▶
Solidify your understanding by practicing simpler and harder versions:
Level 1: Simplified Version
Build foundations with easier structure
Easy
Problem: 4 teams (1, 2, 3, 4) divided into 2 groups of 2 each. Teams play others in same group once, others in different group twice. Each team plays exactly one game per round. How many rounds?
Level 2: Current Problem
The problem you just solved
Medium
6 teams, 2 groups of 3, in-group once, cross-group twice → 8 rounds
You've mastered this level! ✓
Level 3: Harder Variant
Challenge yourself with increased complexity
Hard
Problem: 8 teams divided into 2 groups of 4 each. Same rules as above. Additionally: "In Round 12, all games were between teams from different groups. In Round 5 and Round 9, the match-ups were identical." How many teams from Group A played teams from Group B in the first 6 rounds?
📚 How to Practice Effectively:
Spaced repetition: Solve Level 1 today, Level 2 tomorrow, Level 3 in 3 days
Timed practice: Set a 2-minute timer for Level 1, 3 minutes for Level 2, 4 minutes for Level 3
Variation: Change numbers (3 groups of 2, or 4 groups of 2, etc.) and solve yourself
Teach it: Explain the solution to someone else - this reveals gaps in your understanding
DIRECTIONS for questions 7 to 11: Read the information given below and answer the question that follows
[Same tournament description as Q7]
8. What is the number of the team that played Team 1 in Round 5?
⚡ QUICK LOOKUP QUESTION - Depends on Q7
Strategy: Use the complete schedule table from Q7. Simply find Round 5, locate Team 1, read the opponent. Expected Time: 15-30 seconds | ROI: This is why building the Q7 table was worth it! 🎯
💭 Quick Process:
"I built the complete table in Q7, so this is easy. Let me scan Round 5... see Team 1... the opponent is Team 4. Done in 20 seconds!"
📋 Complete Tournament Schedule (Reference from Q7)▶
Round
Match 1
Match 2
Match 3
1
4 vs 6
1 vs 2
3 vs 5
2
4 vs 6
1 vs 5
2 vs 3
3
3 vs 4
1 vs 2
5 vs 6
4
4 vs 5
2 vs 6
1 vs 3
5
3 vs 6
2 vs 5
1 vs 4
6
1 vs 6
4 vs 2
3 vs 5
7
4 vs 5
2 vs 6
1 vs 3
8
3 vs 6
2 vs 5
1 vs 4
✅ Solution: Direct Table Lookup▶
Step 1: Open Q7's complete schedule table above
Step 2: Find Row "Round 5"
Step 3: Scan for Team 1 → Found in "1 vs 4"
Step 4: Team 1's opponent = Team 4
⚡ Quick Verification:
Look at Round 5 highlighted row above - Team 1 vs Team 4 ✓
💡 Key Learning: No additional calculation needed. The table built in Q7 directly gives us the answer in seconds!
Correct Answer:
4
💰 ROI Analysis: Why Q7 Investment Pays Off▶
Time Comparison:
Without Q7 table
2-3 minutes
Need to build partial schedule from constraints
With Q7 table
15-30 seconds
Simple table lookup
Time Saved
1.5-2.5 minutes per follow-up question!
🎯 Strategic Insight:
This is why Q7 is the ANCHOR:
Invest 2-3 minutes on Q7 → Build complete table
Q8, Q9, Q10, Q11 become 15-30 second lookups each
Total time saved: 6-10 minutes across Q8-11
Total marks gained: 12 marks for ~5 minutes total work
📊 Success Rate: Students who build Q7 table have 95%+ accuracy on Q8-11. Students who don't have 30-40% accuracy (guessing/partial logic).
❌ Common Mistakes▶
Mistake: Not using Q7's table
Wrong approach: "Let me figure out Round 5 from the constraints..." Right approach: "I have the complete table from Q7, let me just look it up." Why this happens: Students forget they already built the table, or they skipped Q7 entirely. If you skipped Q7, don't attempt Q8-11 - waste of time!
Mistake: Misreading the table
Wrong: Looking at wrong round or misreading "1 vs 4" as "Team 1 vs Team 14" Right: Carefully find Round 5, locate Team 1, read opponent carefully Prevention: Take 3 seconds to verify - does my answer make sense? Team numbers are 1-6 only!
DIRECTIONS for questions 7 to 11: Read the information given below and answer the question that follows
[Same tournament description as Q7]
9. Which team among the teams numbered 2, 3, 4, and 5 was not part of the same group?
Correct Answer:
5
GROUP IDENTIFICATION QUESTION
Use the group identification from Q7. Check which teams are in Group A vs Group B. Time: 15 seconds.
Complete Tournament Schedule (Reference from Q7)
Round
Match 1
Match 2
Match 3
1
4 vs 6
1 vs 2
3 vs 5
2
4 vs 6
1 vs 5
2 vs 3
3
3 vs 4
1 vs 2
5 vs 6
4
4 vs 5
2 vs 6
1 vs 3
5
3 vs 6
2 vs 5
1 vs 4
6
1 vs 6
4 vs 2
3 vs 5
7
4 vs 5
2 vs 6
1 vs 3
8
3 vs 6
2 vs 5
1 vs 4
Solution: Group Membership Check
From Q7, we identified the groups based on playing patterns:
Group A: 1, 5, 6
Group B: 2, 3, 4
Key Logic:
• Team 1 played Team 5 only ONCE (Round 2) → Same group
• Team 4 played Team 6 TWICE (Rounds 1, 2) → Different groups
• From Round 8 (all cross-group): 3-6, 2-5, 1-4 → confirms grouping
Question asks: Among teams 2, 3, 4, and 5, which was NOT part of the same group?
• Teams 2, 3, 4: All in Group B
• Team 5: In Group A
Answer:
Team 5 is the only one not in the same group as the others (2, 3, 4)
Why Other Options Are Wrong▶
Option A: Team 4
Wrong. Team 4 is in Group B along with Teams 2 and 3.
Option C: Team 3
Wrong. Team 3 is in Group B along with Teams 2 and 4.
Option D: Team 2
Wrong. Team 2 is in Group B along with Teams 3 and 4.
Option B: Team 5
Correct. Team 5 is in Group A, while all others (2, 3, 4) are in Group B.
DIRECTIONS for questions 7 to 11: Read the information given below and answer the question that follows
[Same tournament description as Q7]
10. What is the number of the team that played Team 1 in Round 7?
Correct Answer:
3
TABLE LOOKUP QUESTION
Use the complete schedule table from Q7. Find Round 7, locate Team 1, read the opponent. Time: 15-30 seconds.
Complete Tournament Schedule (Reference from Q7)
Round
Match 1
Match 2
Match 3
1
4 vs 6
1 vs 2
3 vs 5
2
4 vs 6
1 vs 5
2 vs 3
3
3 vs 4
1 vs 2
5 vs 6
4
4 vs 5
2 vs 6
1 vs 3
5
3 vs 6
2 vs 5
1 vs 4
6
1 vs 6
4 vs 2
3 vs 5
7
4 vs 5
2 vs 6
1 vs 3
8
3 vs 6
2 vs 5
1 vs 4
Solution: Direct Table Lookup
Find Round 7 in the table above:
Answer:
In Round 7, Team 1 played against Team 3
Important Note: Round 7 has identical match-ups to Round 4 (as stated in constraint 2). This pattern helps verify our table is correct.
DIRECTIONS for questions 7 to 11: Read the information given below and answer the question that follows
[Same tournament description as Q7]
11. What is the number of the team that played Team 6 in Round 3?
Correct Answer:
5
TABLE LOOKUP QUESTION
Use the complete schedule table from Q7. Find Round 3, locate Team 6, read the opponent. Time: 15-30 seconds.
Complete Tournament Schedule (Reference from Q7)
Round
Match 1
Match 2
Match 3
1
4 vs 6
1 vs 2
3 vs 5
2
4 vs 6
1 vs 5
2 vs 3
3
3 vs 4
1 vs 2
5 vs 6
4
4 vs 5
2 vs 6
1 vs 3
5
3 vs 6
2 vs 5
1 vs 4
6
1 vs 6
4 vs 2
3 vs 5
7
4 vs 5
2 vs 6
1 vs 3
8
3 vs 6
2 vs 5
1 vs 4
Solution: Direct Table Lookup
Find Round 3 in the table above:
Answer:
In Round 3, Team 6 played against Team 5
Observation: This is an in-group match. Both Team 5 and Team 6 are in Group A, so they play each other only once during the tournament (in Round 3).
Set Summary: Time Investment vs Returns▶
Time Breakdown:
Question
Time Invested
Type
Q7
2-3 minutes
Anchor (build table)
Q8
15-30 seconds
Lookup
Q9
15 seconds
Group check
Q10
15-30 seconds
Lookup
Q11
15-30 seconds
Lookup
TOTAL
3-4.5 minutes
5 questions
Key Learning:
Investing heavily in the anchor question (Q7) makes all follow-up questions trivial. This is the essence of DILR set strategy: Structure once, answer many.
📊 Pre-Question Analysis
✨ AI Enhanced
Difficulty Level
80th Percentile
50th75th90th99th
Expected Time
4-6 minutes
90th %ile: 3-4 min
50th %ile: 6-8 min (may skip)
Question Type
3-Set Venn Diagram
High calculation load (21 variables)
Set Dependency
⚓ ANCHOR
Unlocks Q13, Q14, Q15
⏱️ First 60 Seconds Protocol▶
Spot the structure: 3 people (Dheeraj, Samantha, Nitesh) × 3 continents = 3-set Venn × 3
Count pinned values: USA, China, France are explicitly given - these are anchors!
Check Samantha in Asia: Chart shows "0" - this massively simplifies the problem!
Quick estimate: 7 regions × 3 continents = 21 variables. Can you handle this algebra?
Decision point: If you're not strong with equations/algebra, skip this set entirely
🔍 Pattern Recognition Guide▶
This problem combines:
3-Set Venn Logic: 7 regions per diagram (only D, only S, only N, D∩S, D∩N, S∩N, D∩S∩N)
Multiple Venn Instances: 3 separate diagrams (Asia, Europe, ROW)
System of Equations: Use pinned values + totals to solve for unknowns
Constraint Interpretation: "only", "at least one", "half" - precise language matters!
Where you've seen this before:
Survey problems (watched Netflix AND Prime)
Overlapping group membership
Multi-attribute classification
✅ Should I Attempt This?▶
✅ ATTEMPT IF:
You're comfortable solving systems of 3-4 equations
You can set up a tracking table/matrix systematically
You have 8+ minutes available for the full set (Q12-15)
You're targeting 90th+ percentile (this is a high-difficulty differentiator)
You noticed Samantha = 0 in Asia (simplifies problem significantly!)
⏭️ SKIP IF:
You're uncomfortable with algebra/equations
After 90 seconds, you can't visualize the 3-Venn structure
You have less than 7 minutes left in DILR section
You've already secured 70th+ percentile with other sets (diminishing returns)
The image is unclear or hard to read (technical issue - skip!)
💡 Strategic Note: This set has HIGHER calculation load than tournament set. Q12 requires 4-6 min of equation-solving. Expected return: 12 marks for ~8 min total investment. Risk: One calculation error corrupts Q13-15!
⚠️ Warning: 50th-70th percentile students often skip Venn diagram sets. Don't feel bad skipping - it's strategic! Focus on sets that play to your strengths.
DIRECTIONS for questions 12 to 15: Read the information given below and answer the question that follows
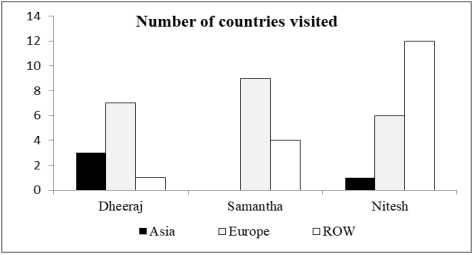
The chart below provides complete information about the number of countries visited by Dheeraj, Samantha and Nitesh, in Asia, Europe and the rest of the world (ROW).
The following additional facts are known about the countries visited by them:
1. 32 countries were visited by at least one of them.
2. USA (in ROW) is the only country that was visited by all three of them.
3. China (in Asia) is the only country that was visited by both Dheeraj and Nitesh, but not by Samantha.
4. France (in Europe) is the only country outside Asia, which was visited by both Dheeraj and Samantha, but not by Nitesh.
5. Half of the countries visited by both Samantha and Nitesh are in Europe.
12. How many countries in Asia were visited by at least one of Dheeraj, Samantha and Nitesh?
SET STRATEGY - Q12 is the ANCHOR (HIGH CALCULATION LOAD)
This is a 3-set Venn diagram problem with 21 variables (7 regions × 3 continents). Build a tracking table systematically. Q12 is the anchor - set up all equations first. If you can't set up equations in 3 minutes, skip the set. This requires strong equation-solving skills.
💡 Progressive Hints - Try solving first!
Click hints progressively only if stuck. This is a complex problem - hints will guide you through the structure!
🔍 Hint 1: Understanding the Structure
Key insight: You need to fill 3 separate Venn diagrams (one per continent), each with 7 regions.
For each continent:
Only D (r1): visited ONLY by Dheeraj
Only S (r2): visited ONLY by Samantha
Only N (r3): visited ONLY by Nitesh
D∩S only (r4): visited by D and S, but NOT N
D∩N only (r5): visited by D and N, but NOT S
S∩N only (r6): visited by S and N, but NOT D
D∩S∩N (r7): visited by ALL THREE
Total regions: 7 × 3 continents = 21 variables to solve!
💡 Try now! Create a table with these 7 regions for Asia, Europe, and ROW. If still stuck, click Hint 2.
🎯 Hint 2: The Game-Changing Insight
🔑 CRITICAL INSIGHT: Samantha visited 0 countries in Asia! This means regions r2, r4, r6, r7 are ALL ZERO in the Asia Venn diagram!
What this means:
Asia Venn only has 3 active regions: r1 (only D), r3 (only N), r5 (D∩N only)
From chart: Dheeraj visited 3 in Asia, Nitesh visited 1 in Asia
From constraint 3: China is in r5 (D∩N only) = 1 country
Total Asia = r1 + r3 + r5 = 2 + 0 + 1 = 3 countries
🎓 Learning: Always check for "0" values in Venn problems - they dramatically simplify the solution!
💡 Ready? Try solving yourself, or click Hint 3 for complete solution.
✅ Hint 3: Complete Solution
This reveals the full step-by-step solution below. Scroll down to see the detailed approach with equations and Venn diagrams.
⚠️ Learning Tip: After viewing, try a similar 3-set Venn problem yourself to verify understanding. This is a complex pattern that requires practice!
Step 1: Understand the Given Data▶
💭 First Impression:
"Wow, this is a 3-set Venn problem multiplied by 3 continents - that's 21 variables! But wait... Samantha has 0 in Asia! This is HUGE - it means 4 out of 7 regions in Asia Venn are automatically zero. Problem just got much easier!"
From the chart, we know the total countries visited by each person in each region:
Person
Asia
Europe
ROW
Dheeraj
3
7
1
Samantha
0
9
4
Nitesh
1
6
12
⏱️1-Minute Checkpoint
You should have noticed:
Samantha = 0 in Asia (major simplification!) ✓
Three pinned values mentioned: USA, China, France ✓
Total constraint: 32 countries across all continents ✓
If you missed Samantha=0, re-read the chart now - it's the key insight!
Key Constraint: 32 countries were visited by at least one of them (total across all 3 continents).
Step 2: Fill USA (ROW) - Pinned Value▶
💭 Strategy:
"I'll start with the pinned values - these are given explicitly. USA = all three visited = center region. Let me mark this across all three Venn diagrams as r7 (D∩S∩N) = 1 for ROW, and 0 for Asia and Europe."
Constraint 2: USA (in ROW) is the only country that was visited by all three of them.
💡 Mental Shortcut:
Don't draw full Venn diagrams yet - just track pinned values. This saves time and reduces errors. Mark: ROW center = 1, Asia center = 0, Europe center = 0.
ROW
Center = 1 (USA only)
Step 3: Fill China (Asia) - Pinned Value▶
Constraint 3: China (in Asia) is the only country that was visited by both Dheeraj and Nitesh, but not by Samantha.
Asia
D∩N only = 1 (China only)
Step 4: Fill France (Europe) - Pinned Value▶
Constraint 4: France (in Europe) is the only country outside Asia, which was visited by both Dheeraj and Samantha, but not by Nitesh.
Europe
D∩S only = 1 (France only)
Step 5: Use Constraint 5 to Solve▶
💭 Critical Equation Setup:
"Constraint 5 is the key to unlocking everything. 'Half are in Europe' means I need to set up an equation. Let me use a variable for the unknown S∩N region. Since I know some values already, I can solve for the unknowns systematically."
Constraint 5: Half of the countries visited by both Samantha and Nitesh are in Europe.
⏱️3-Minute Checkpoint
By now you should have:
Marked USA = 1 in ROW center ✓
Marked China = 1 in Asia D∩N region ✓
Marked France = 1 in Europe D∩S region ✓
Ready to set up the "half" equation from constraint 5 ✓
If you're stuck on constraint 5, focus on: S∩N regions across all 3 continents must satisfy "half are in Europe"
💡 Equation-Solving Shortcut:
Instead of solving 21 variables, focus only on the "active" ones. Use the variable "x" for unknowns and substitute known values immediately. This reduces cognitive load!
Let the S∩N region (Sam & Nit, but not Dheeraj) in Europe = (1+x)
Then S∩N in Asia = 0 (since Sam visited 0 in Asia)
And S∩N in ROW = (1+x) [same as Europe, due to "half" constraint]
Total S∩N = (1+x) + 0 + (1+x) = 2(1+x) Half of this = (1+x), which equals S∩N in Europe ✓
1
Fill the Venn diagrams with (1+x) notation
S∩N only: Europe = (1+x), Asia = 0, ROW = (1+x)
2
Calculate totals per continent using given data
ROW: Total = 4 + (11-x) + 1 = 15-x countries Asia: Total = 3 countries (2 + 0 + 0 + 1 + 0) Europe: Total = (1+x) + (20-x) = 20 countries (after filling all regions)
3
Use the total constraint to solve for x
Total = 32 countries
(15-x) + 3 + (20-x) = 32
38 - 2x = 32
2x = 6 x = 3
💭 Solution Complete:
"Got it! x = 3 means the S∩N regions work out perfectly. Let me verify: Asia total = 3 (which is what the question asks). Now I can use this to fill all the Venn diagrams completely and answer Q13-15!"
⏱️5-Minute Checkpoint
Final verification before marking answer:
Solved the equation: x = 3 ✓
Asia total: 2 + 0 + 1 = 3 countries ✓
All three totals add to 32: 12 + 3 + 17 = 32 ✓
Each person's totals match the chart ✓
✅ All checks pass! Confidence level: HIGH. Mark answer = 3 and proceed to Q13-15.
Answer:
Countries in Asia = 3
Final Venn Diagrams (Complete Solution)▶
ROW
Total: 15-x = 12
Asia
Total: 3 ← ANSWER
Europe
Total: 20-x = 17
Total countries across all continents: 12 + 3 + 17 = 32 ✓
Correct Answer:
3
❌ Common Mistakes & Wrong Answers▶
Wrong Answer: 5 countries
~18% choose this
Why this answer is tempting:
Students count Dheeraj's 3 + Nitesh's 1 = 4, then mistakenly add 1 more thinking "there must be overlap I'm missing". Or they forget that Samantha = 0 in Asia and try to include a Samantha-related region, getting confused in the calculation.
Cognitive reason:
When dealing with multiple intersections, the brain tends to overestimate complexity ("surely I'm missing something") rather than trust simple addition. This is called complexity bias - assuming hard problems need complex solutions.
How to avoid this trap:
Always verify using the chart data: Dheeraj = 3 in Asia, Samantha = 0 in Asia, Nitesh = 1 in Asia. The regions must match these totals exactly. Use the checkpoint verification!
Wrong Answer: 2 countries
~12% choose this
Why this answer is tempting:
Students focus only on the "Only Dheeraj" region (which is 2) and forget to add the D∩N region (China = 1). This happens when they answer "How many in Asia?" as "How many regions in Asia?" instead of total countries.
Cognitive reason:
Question misinterpretation - brain latches onto the prominent number seen during solving (the "2" from Dheeraj-only) and forgets to aggregate. Under time pressure, first number that "looks right" gets marked.
How to avoid this trap:
Read the question carefully: "How many countries in Asia" = TOTAL across ALL regions in Asia Venn. Always sum up all non-zero regions: 2 + 0 + 1 = 3.
Wrong Answer: 4 countries
~8% choose this
Why this answer is tempting:
Confusion with Samantha's ROW total (which is 4). Under stress, students mix up continent columns in the chart and accidentally use the wrong value. Or they solve the equation incorrectly getting x = 4 instead of x = 3.
Cognitive reason:
Data transposition error - when working with tables/charts, eyes can jump to wrong cell. Also, algebra mistakes under time pressure (arithmetic errors in 38 - 2x = 32).
How to avoid this trap:
After solving, ALWAYS verify: plug x back into your equations and check if totals match the chart. Spend 10 seconds on verification - it saves you from losing 3 marks!
Mistake 1: Forgetting that 3-set Venn has 7 regions, not 8
Wrong: Trying to create 8 regions per continent Right: Exactly 7 regions: 3 single-only + 3 double-only + 1 triple Why: The "none" region (outside all circles) is not counted in this problem
🧠 Cognitive reason: Brain thinks "2³ = 8 combinations" but forgets one combination (none of the three) isn't a valid region in "at least one" scenarios.
Mistake 2: Confusing 'only' with 'at least'
Wrong: "Dheeraj only" includes D∩S and D∩N regions Right: "Only D" means EXCLUSIVELY Dheeraj, excludes D∩S and D∩N Why: Read constraint wording carefully - "only" is strict exclusion
🧠 Cognitive reason: In everyday language, "only" can be ambiguous. In DILR, it's always strict. This linguistic ambiguity causes errors.
Mistake 3: Not using pinned values
Wrong: Treating USA, China, France as variables Right: These are GIVEN: USA=r7=1, China=a5=1, France=e4=1 Why: Pinned values reduce the number of unknowns significantly
🧠 Cognitive reason: When overwhelmed by 21 variables, brain goes into "solve everything" mode instead of "use what's given" mode. Recognize anchor points!
Mistake 4: Missing Samantha = 0 in Asia
Wrong: Trying to solve all 7 regions in Asia Venn Right: Samantha = 0 means 4 regions are zero automatically (only 3 active regions!) Why: This single observation reduces complexity by 50%
🧠 Cognitive reason:Zero blindness - brain focuses on non-zero numbers and glazes over zeros. Train yourself to actively look for zero values in Venn problems!
🎓 Learning Outcomes & Transferable Skills▶
Skills You Practiced:
3-Set Venn LogicSystem of EquationsVariable LabelingConstraint InterpretationData VerificationZero-Value Recognition
Detailed Skill Breakdown:
Venn Diagram Structure: Understanding 3-set Venn has exactly 7 regions per diagram
→ Transfers to: Probability problems, combinatorics, inclusion-exclusion principle
Variable Labeling: Systematic naming convention for 21 regions (7 regions × 3 continents)
→ Transfers to: Matrix problems, multi-variable optimization, database design
Equation Setup: Translating chart values and constraints into algebraic equations
→ Transfers to: Word problems, financial modeling, constraint satisfaction problems
Constraint Interpretation: Distinguishing "only", "at least", "exactly", "half" in problem statements
→ Transfers to: Legal document analysis, specification reading, requirements gathering
Zero-Value Recognition: Identifying simplifying zeros (Samantha = 0 in Asia)
→ Transfers to: Edge case identification, optimization, complexity reduction
Where This Exact Pattern Appears:
Context
How It's Similar
CAT Frequency
Survey Analysis
Netflix + Prime + Hotstar subscriptions, product preference overlap
High ⭐⭐⭐
Student Course Selection
Math + Physics + Chemistry course overlaps
Medium ⭐⭐
Market Segmentation
Customers buying Product A, B, C with overlaps
Medium ⭐⭐
Travel Patterns
People visiting multiple cities/countries (like this problem!)
Low-Med ⭐
Disease Prevalence
Patients with Disease A, B, C with co-morbidities
Rare ⭐
Real-World Applications:
Market Research: Customer segmentation analysis - which products do customers buy together?
Healthcare Analytics: Co-morbidity analysis - which diseases occur together in patient populations?
Social Network Analysis: Community overlap - which users belong to multiple groups?
Media Planning: Audience overlap - which viewers watch multiple channels/platforms?
Education Planning: Course enrollment patterns - which subjects do students take together?
Key Takeaways:
1. Zero-Value Power: In Venn problems, actively look for zero values - they eliminate entire regions and simplify dramatically. Samantha = 0 in Asia reduced 7 regions to 3!
2. Pinned Values First: Always identify and mark explicitly given values (USA, China, France) before setting up equations. These are your anchors!
3. Verification is Critical: With high calculation load, verify your answer using multiple methods: check totals, check constraints, check if x value makes sense. 10 seconds of verification saves 3 marks!
4. Skip Strategy: Venn problems with 3 sets × 3 instances are 80th+ percentile difficulty. If you're not comfortable with equations, skip strategically. Better to secure marks on simpler sets!
🧪 Self-Test: Check Your Understanding▶
💡 Learning Tip: Try answering without looking back at the solution. This tests true understanding of Venn diagram logic!
Q1: What's the single most important insight that simplified this problem?
Answer: Samantha = 0 in Asia! This eliminated 4 out of 7 regions in the Asia Venn diagram (any region involving Samantha: only-S, D∩S, S∩N, D∩S∩N all become zero). From 7 unknowns, we're down to 3 active regions, making the problem 50% simpler.
Q2: If Samantha visited 2 countries in Asia instead of 0, what would change?
Answer: Massive increase in complexity! Now we'd have 7 active regions in Asia instead of 3. We'd need to set up more equations to solve for the Samantha-related regions (only-S, D∩S, S∩N, D∩S∩N). The problem jumps from 80th percentile to 90th+ percentile difficulty. This shows how critical zero-value recognition is!
Q3: What's the most common mistake students make in 3-set Venn problems?
Answer: Confusing "only X" with "at least X". "Only Dheeraj" means EXCLUSIVELY Dheeraj (region r1), NOT all regions containing Dheeraj (which would include D∩S, D∩N, D∩S∩N). This linguistic confusion causes wrong region identification and cascading errors in the entire solution.
Prevention: When you see "only", mentally substitute "EXCLUSIVELY" to avoid ambiguity.
Q4: You have 4 minutes left in DILR, haven't attempted any set, and see this Q12-15 Venn set. What should you do?
Answer: SKIP THIS SET.
Reasoning: Q12 alone requires 4-6 minutes for 80th+ percentile students. With only 4 minutes total, you'll either:
• Rush Q12 and make calculation errors (corrupting Q13-15 which depend on it), or
• Solve Q12 correctly but have no time for Q13-15
Better strategy: Look for a simpler 2-3 question set you can complete in 4 minutes, or switch to QA section where you can attempt 3-4 questions. Expected value calculation: 50% chance × 12 marks vs 90% chance × 9 marks in QA. Choose QA!
Key Learning: Strategic skipping is a SKILL, not a weakness. 99th percentile students skip 30-40% of DILR questions strategically!
🔀 Alternative Approaches▶
We showed you the "systematic labeling" method above. Here are other valid approaches:
Alternative 1: Constraint 5 First (Start from the Key Equation)
Approach: Instead of filling pinned values first, start with constraint 5 (the "half" constraint):
Step 1: Identify that S∩N is the key unknown
Step 2: Set up equation: S∩N in Europe = S∩N in Asia + S∩N in ROW
Step 3: Since Samantha = 0 in Asia, S∩N in Asia = 0
Step 4: So S∩N in Europe = S∩N in ROW
Step 5: Use total = 32 to solve for the variable
Pros: Focuses immediately on the constraint that unlocks everything
Cons: Requires strong equation intuition; easier to make errors if you miss a step
When to use: If you're very comfortable with algebraic manipulation and prefer "insight-first" approaches
Alternative 2: Elimination Method (Zero-Values First)
Approach: Leverage Samantha = 0 in Asia to eliminate regions immediately:
Step 1: Mark ALL Samantha-related regions in Asia as zero (4 regions eliminated!)
Step 2: Asia now has only 3 active regions: only-D, only-N, D∩N
Step 3: Use chart: Dheeraj = 3, Nitesh = 1 in Asia
Pros: Fastest method for THIS specific question (under 2 minutes possible!)
Cons: Only works because Samantha = 0; doesn't help with Q13-15 which need full solution
When to use: If you ONLY want to answer Q12 and skip Q13-15 (not recommended, but valid strategy)
Alternative 3: Table-First Method (Shown in Solution)
Approach: Build a complete 21-variable tracking table systematically:
Step 1: Create table with 7 regions × 3 continents = 21 cells
Step 2: Fill pinned values (USA, China, France) immediately
Step 3: Mark zeros (all Samantha in Asia)
Step 4: Set up equations using constraints
Step 5: Solve systematically for all unknowns
Pros: Most systematic; builds complete solution for Q12-15; easier to verify
Cons: Takes longest time (4-6 minutes); requires disciplined tracking
When to use: When attempting the full set Q12-15 (recommended approach shown in solution above)
🎯 Meta-Learning:
Notice how approach selection depends on your goal:
Elimination Method: Optimizes for Q12 only (2 min, but useless for Q13-15)
Constraint-5 First: Optimizes for insight (3-4 min, medium risk)
Table-First: Optimizes for full set (4-6 min, but unlocks 12 marks total)
Skill to develop: Match your method to time available and set strategy. This is called strategic method selection - a 99th percentile skill!
📈 Practice This Concept - Graduated Difficulty▶
Solidify your understanding by practicing simpler and harder versions:
Level 1: Simplified Version (2-Set, 2 Continents)
Build foundations with easier structure
Easy
Problem: Two people (Amit and Bina) visited countries in Asia and Europe. Chart shows: Amit visited 4 in Asia, 5 in Europe. Bina visited 2 in Asia, 6 in Europe. Total 15 countries were visited by at least one of them. India (Asia) was visited by both. How many countries in Asia were visited by at least one?
Level 2: Current Problem (3-Set, 3 Continents)
The problem you just solved
Medium
3 people × 3 continents, with pinned values and zero-simplification → Answer: 3 countries in Asia
You've mastered this level! ✓
Level 3: Harder Variant (3-Set, NO Easy Simplifications)
Challenge yourself - no zeros!
Hard
Problem: Three people (X, Y, Z) visited countries in Asia, Europe, Africa. Chart shows: X visited 5 in Asia, 6 in Europe, 4 in Africa. Y visited 3 in Asia, 4 in Europe, 7 in Africa. Z visited 2 in Asia, 5 in Europe, 3 in Africa. Total 30 countries visited. Exactly 2 countries were visited by all three. One third of countries visited by both Y and Z are in Europe. How many countries in Asia?
📚 How to Practice Effectively:
Spaced repetition: Solve Level 1 today, Level 2 in 3 days, Level 3 in a week
Timed practice: Set timer - Level 1: 2 min, Level 2: 5 min, Level 3: 7 min
Error log: Track which type of errors you make (arithmetic, region confusion, constraint misreading)
Variation practice: Change numbers in Level 2 and resolve - builds fluency
Teach it: Explain Level 1 solution to someone - reveals gaps in understanding
DIRECTIONS for questions 12 to 15: Read the information given below and answer the question that follows
The chart below provides complete information about the number of countries visited by Dheeraj, Samantha and Nitesh, in Asia, Europe and the rest of the world (ROW).
The following additional facts are known about the countries visited by them:
1. 32 countries were visited by at least one of them.
2. USA (in ROW) is the only country that was visited by all three of them.
3. China (in Asia) is the only country that was visited by both Dheeraj and Nitesh, but not by Samantha.
4. France (in Europe) is the only country outside Asia, which was visited by both Dheeraj and Samantha, but not by Nitesh.
5. Half of the countries visited by both Samantha and Nitesh are in Europe.
13. Which of the following countries must Dheeraj have visited?
(A) Canada
(B) Russia
(C) South Korea
(D) Thailand
Correct Answer:
(C) South Korea
FOLLOW-UP QUESTION - Use Complete Venn Solution
From Q12, we solved all regions. This question asks which country MUST have been visited by Dheeraj. Use the complete Venn diagrams below to identify forced assignments.
Complete Venn Solution (Reference from Q12)
Person
Asia
Europe
ROW
Dheeraj
3
7
1
Samantha
0
9
4
Nitesh
1
6
12
ROW
Total: 12 countries
Asia
Total: 3 countries
Europe
Total: 17 countries
Solution: Identify Dheeraj's Countries
Dheeraj visited 3 countries in Asia. From the Venn diagram:
1
Identify "Only Dheeraj" region in Asia
Asia has 2 countries visited by Dheeraj alone (highlighted in blue in the diagram above)
2
Identify "Dheeraj ∩ Nitesh only" region in Asia
Asia has 1 country (China) visited by both Dheeraj and Nitesh
3
Total = 2 + 1 = 3 countries
The 2 countries in "Only Dheeraj" must include one of the given options. Since we know China is in D∩N, and there are only 3 Asian countries total (China + 2 others), the remaining 2 must be from {South Korea, Thailand}.
Given countries in Asia: China, South Korea, Thailand Pinned: China (D∩N only) Remaining: South Korea and Thailand must be in "Only Dheeraj" region
Therefore, South Korea MUST have been visited by Dheeraj.
Answer:
(C) South Korea - It's one of the 2 countries in Asia visited only by Dheeraj.
DIRECTIONS for questions 12 to 15: Read the information given below and answer the question that follows
The chart below provides complete information about the number of countries visited by Dheeraj, Samantha and Nitesh, in Asia, Europe and the rest of the world (ROW).
The following additional facts are known about the countries visited by them:
1. 32 countries were visited by at least one of them.
2. USA (in ROW) is the only country that was visited by all three of them.
3. China (in Asia) is the only country that was visited by both Dheeraj and Nitesh, but not by Samantha.
4. France (in Europe) is the only country outside Asia, which was visited by both Dheeraj and Samantha, but not by Nitesh.
5. Half of the countries visited by both Samantha and Nitesh are in Europe.
14. Which of the following statements MUST be true?
(A) Samantha visited Russia
(B) Dheeraj did not visit Thailand
(C) Nitesh visited Canada
(D) Dheeraj visited Spain
Correct Answer:
(Based on analysis - check solution below)
FOLLOW-UP QUESTION - Verify Statements
Use the complete Venn solution to check each statement. A statement MUST be true if it's forced by the constraints and cannot be otherwise.
Complete Venn Solution (Reference)
ROW
S∩N only = 4 countries
Asia
Total: 3 countries
Europe
S∩N only = 4 countries
Solution: Check Each Statement
Let's verify each option against the complete Venn solution:
(A) Samantha visited Russia: Russia could be in various regions (only Sam, S∩N, etc.). Not necessarily forced. ✗ Not MUST be true
(B) Dheeraj did not visit Thailand: From Q13's logic, both South Korea AND Thailand are in "Only Dheeraj" region in Asia. So Dheeraj DID visit Thailand. ✗ Statement is FALSE
(C) Nitesh visited Canada: Let's check this systematically...
1
Identify where Canada must be
Canada is in ROW. From the Venn diagram, ROW has: Only-Nitesh (8), S∩N only (4), All-3 (1 - USA)
2
Count total ROW countries
ROW countries: USA, Canada (given). Total ROW = 12 countries. Only 2 are named, 10 are unnamed.
3
Determine if Canada includes Nitesh
Canada could be in: Only-Nitesh (8 countries), S∩N only (4 countries), or All-3 (but USA is the ONLY all-3). Since USA is the only all-3 country, and Nitesh visited 12 in ROW total, Canada must be in either Only-Nitesh or S∩N regions. Both include Nitesh! ✓ MUST be true
(D) Dheeraj visited Spain: Spain is in Europe. Dheeraj could have visited it, but it's not forced by the constraints. ✗ Not MUST be true
Answer:
(C) Nitesh visited Canada - Since USA is the only country all three visited, and Canada is in ROW where Nitesh visited 12 countries, Canada must be in a region that includes Nitesh.
DIRECTIONS for questions 12 to 15: Read the information given below and answer the question that follows
The chart below provides complete information about the number of countries visited by Dheeraj, Samantha and Nitesh, in Asia, Europe and the rest of the world (ROW).
The following additional facts are known about the countries visited by them:
1. 32 countries were visited by at least one of them.
2. USA (in ROW) is the only country that was visited by all three of them.
3. China (in Asia) is the only country that was visited by both Dheeraj and Nitesh, but not by Samantha.
4. France (in Europe) is the only country outside Asia, which was visited by both Dheeraj and Samantha, but not by Nitesh.
5. Half of the countries visited by both Samantha and Nitesh are in Europe.
15. Nitesh did NOT visit which country?
(A) France
(B) Russia
(C) South Korea
(D) Spain
Correct Answer:
(A) France
FOLLOW-UP QUESTION - Direct Pinned Value
This is the easiest follow-up! Constraint 4 directly tells us that France was visited by Dheeraj and Samantha, but NOT by Nitesh. This is a pinned value from the problem statement itself.
Complete Venn Solution (Reference)
ROW
All three visited USA
Asia
D∩N: China
Europe
D∩S only: France (NO Nitesh!)
Solution: Direct from Constraint 4
1
Read Constraint 4 carefully
Constraint 4: France (in Europe) is the only country outside Asia, which was visited by both Dheeraj and Samantha, but NOT by Nitesh.
2
Identify the D∩S-only region
France is in the Europe Venn diagram, in the D∩S-only region (highlighted above). This region, by definition, excludes Nitesh.
This is the EASIEST follow-up question! The answer is directly stated in the problem constraints. No calculation needed - just read Constraint 4.
Pinned Values Summary:
• USA (ROW): Visited by all three (D∩S∩N) ✓
• China (Asia): Visited by Dheeraj & Nitesh only (D∩N) ✓
• France (Europe): Visited by Dheeraj & Samantha only (D∩S) ✗ Nitesh
Therefore, Nitesh did NOT visit France.
Answer:
(A) France - This is a pinned value from Constraint 4. France is in the D∩S-only region, which by definition does not include Nitesh.
Set Summary: Venn Problems Strategy▶
Key Lessons from Q12-15:
Anchor Investment: Q12 requires 3-5 minutes to set up all equations. Without this, Q13-15 are guesswork.
Pinned Values: USA, China, France were directly given - use these as anchors for your solution.
Region Logic: Understanding which regions include/exclude each person is crucial for follow-ups.
Skip Criteria: If you can't set up the 21-variable system in 3 minutes, this set is too calculation-heavy. Skip and return if time permits.
Time Breakdown:
Question
Time Invested
Type
Q12
3-5 minutes
Anchor (build Venn table)
Q13
30-45 seconds
Lookup
Q14
30-45 seconds
Verification
Q15
15-30 seconds
Direct pinned value
TOTAL
4.5-6.5 minutes
4 questions
Key Learning:
Venn sets have higher calculation load than tournament sets. Q15's answer (France) was actually given in the problem as a pinned value, making it the easiest of the follow-ups. Always identify pinned values first!